WHAT YOU ARE LOOKING AT
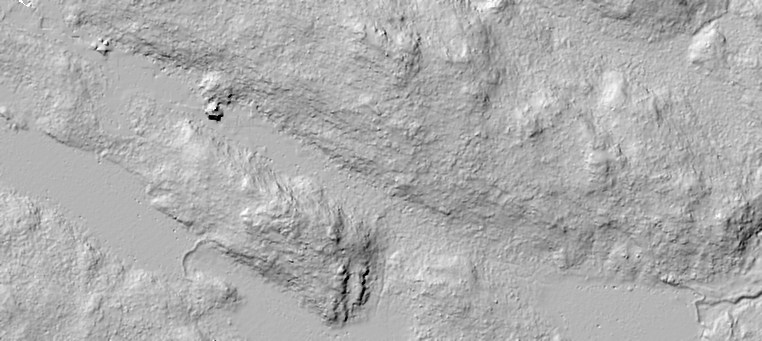
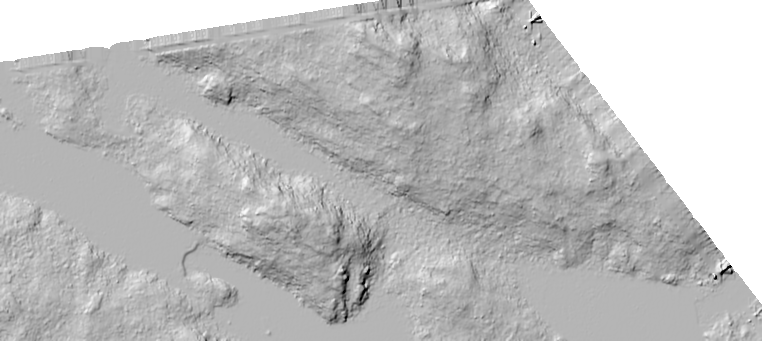
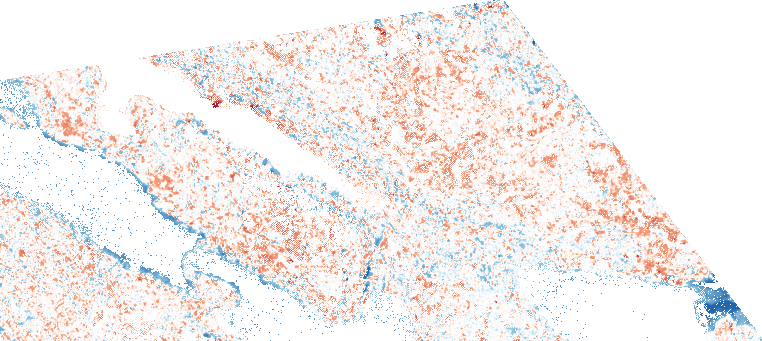
The same quarter square kilometre of Canadian Shield lakeshore, laser-scanned in 2018 and again in 2023 — by different aircraft with different sensors. Each flight is solved to bare earth independently; the shaded terrain you are dragging between is those two solutions. The colour overlay is their difference: red where the ground surface is lower than it was, blue where it is higher.
Confidence grade for this pair: HIGH — both flights solved cleanly (two independent solvers agreed on ~98% of the ground in each).
THE NUMBERS, WITH THEIR RULES
| Area compared | 259,842 m² |
| Unchanged (within ±15 cm) | 112,426 m² |
| Ground higher than 2018 | 9,103 m² · +3,303 m³ |
| Ground lower than 2018 | 13,063 m² · −3,131 m³ |
| Open water (excluded) | 33,299 m² |
| No claim made | 91,951 m² |
| Canopy gained / lost | 104,368 m² / 1,663 m² |
"Change" here means more than 15 cm of vertical difference — a stated rule, printed with every report. Open water is excluded from every earth-movement number: laser returns off a lake measure its level, not the ground. Where the two flights' solutions were not sure of the ground, the map says no claim instead of pretending.
READING THIS HONESTLY
Fine speckle is the sensors talking, not the ground. The 2018 flight measured 5 points per square metre; 2023 measured 22. Between sensor generations a 15 cm rule keeps a little noise — pairs flown on the same equipment read cleaner still.
Where the map is clear, that is a statement too: lakes are excluded by rule, and ground the solvers could not agree on is declared no-claim rather than guessed. Knowing what a measurement can and cannot claim is the product.
WHAT THIS DOES FOR A WATERSHED OR A SITE
Erosion on a river reach between spring flights. Unauthorized fill or excavation on regulated land. Stockpile balance across a season. Canopy loss after a storm — each is this same subtraction: two flights, one honest map, volumes attached.
Processed end-to-end on Northline-controlled infrastructure in North America; nothing is sent to any third-party scanning service.